
P&L Templates You Own
Most operators find out how the month went about six weeks after it ended, when the bookkeeping catches up. That is roughly five weeks too late to do anything about it. These are the workbooks you run yourself, weekly, in Excel.
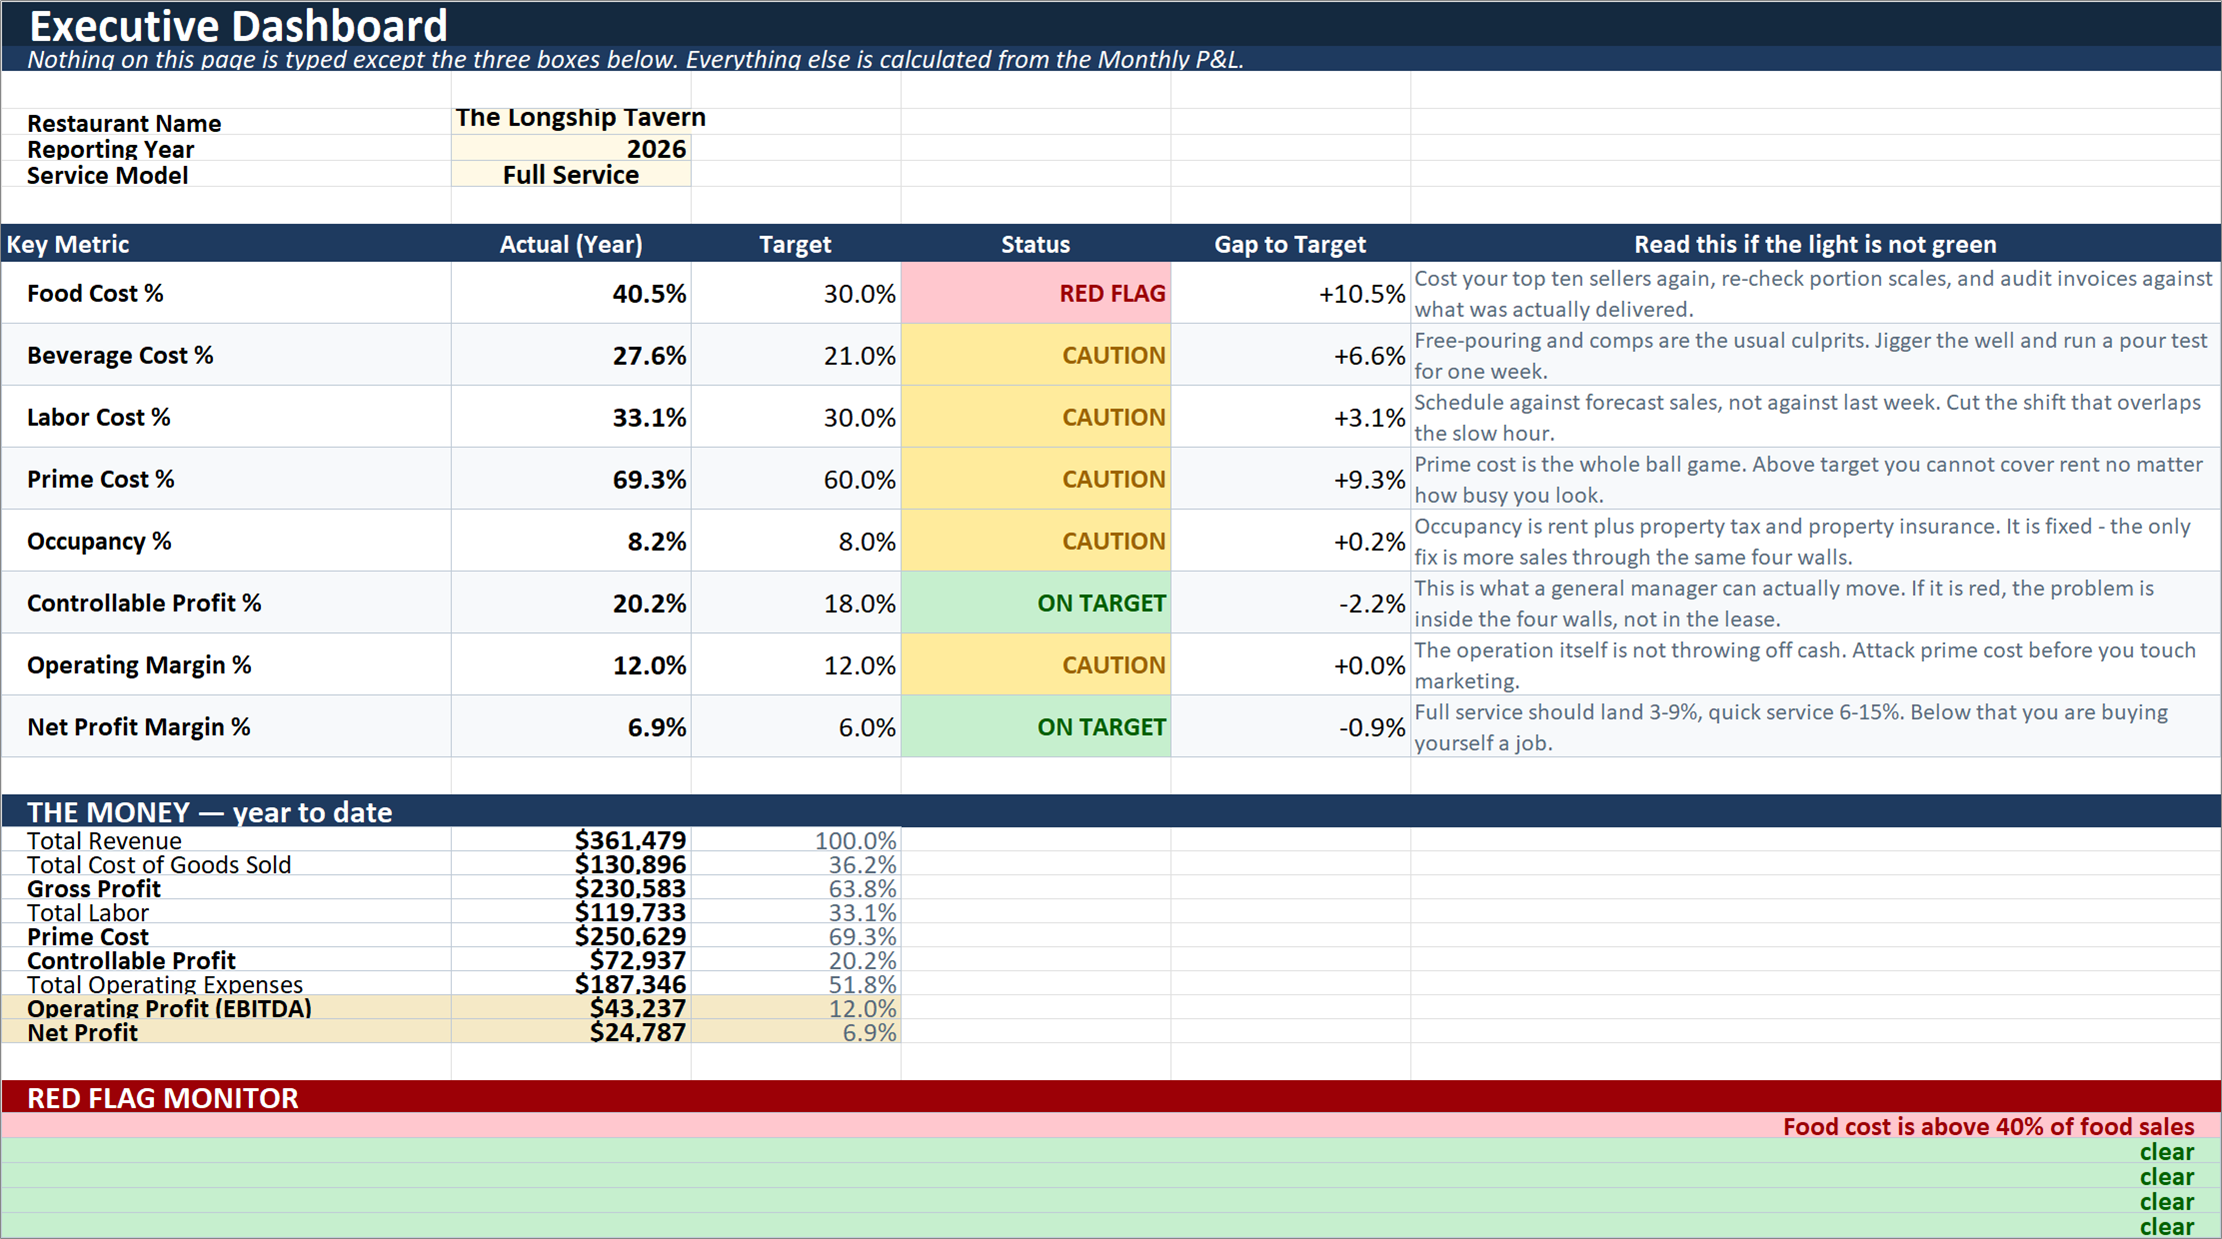
The executive dashboard. Type one month into the P&L and every light on this page decides itself.
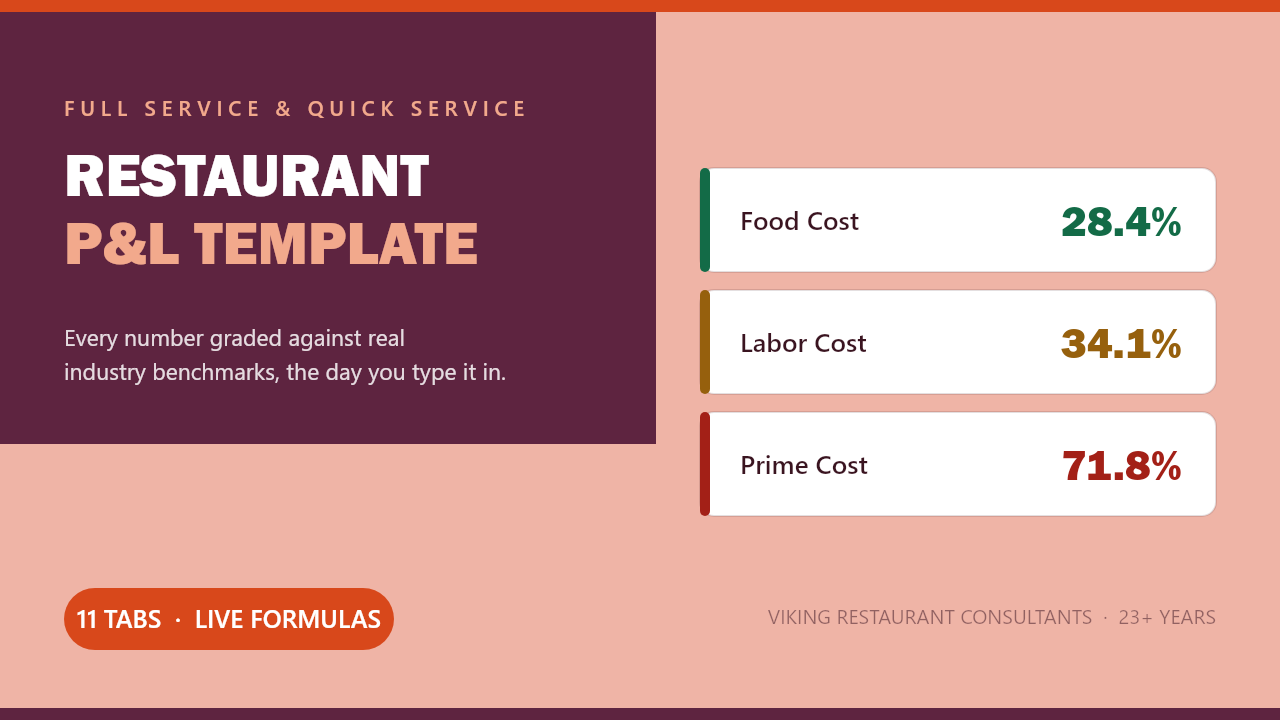
Restaurant P&L
Prime cost struck the moment you type your numbers in, with a traffic light on it. Full service should land 55 to 65 percent. Above 70 you are working harder every week for nothing.
- Eight metrics graded against real industry targets
- Break-even in sales per day, plus your margin of safety
- This month beside the same month last year
- Laid out on the Uniform System of Accounts for Restaurants
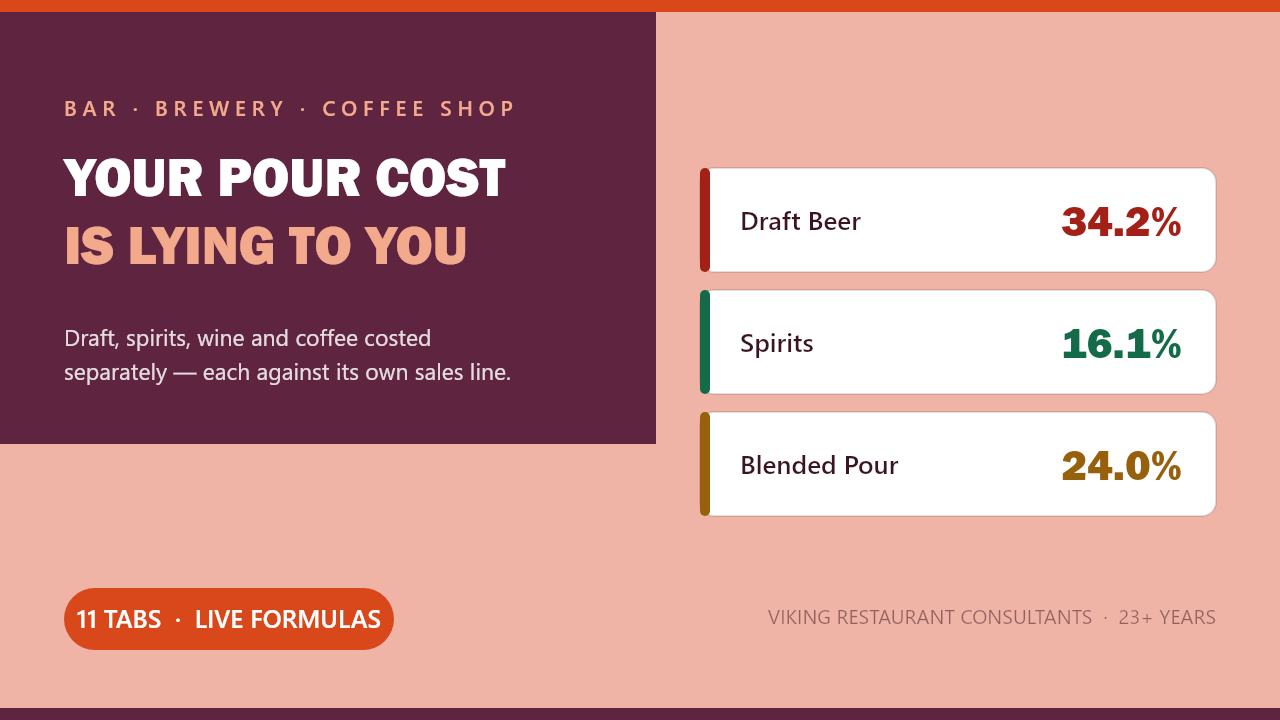
Bar, Brewery & Coffee P&L
A blended pour cost of 24 percent can hide a 34 percent draft problem behind a 16 percent spirits program. One number tells you something is wrong. It never tells you where.
- Every drink category costed against its own sales line
- Draft, packaged, wine, spirits and coffee measured separately
- Nine dashboard metrics with targets and traffic lights
- One dropdown switches benchmarks between bar, taproom and cafe
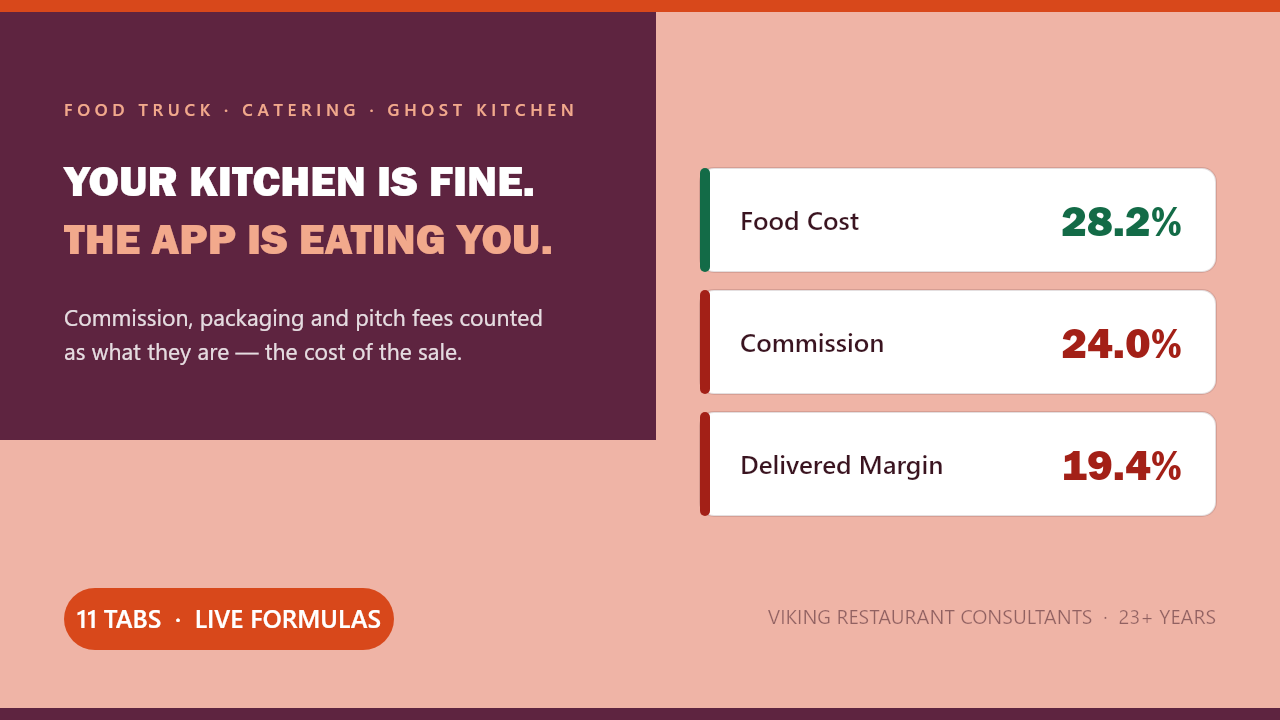
Food Truck, Catering & Ghost Kitchen P&L
You can run a 28 percent food cost and still lose money every month, because 24 percent of the ticket left as platform commission before anybody got paid.
- Delivered gross margin — what is left after the cost of reaching the customer
- Commission measured against third-party sales, not total sales
- Every event ranked by contribution, so you rebook the ones that paid
- Revenue split by channel: walk-up, events, catering, direct, third-party
What Is Inside Every Workbook
You type in the cream-shaded input cells. Everything else calculates itself, and the traffic lights tell you what is wrong without you knowing a single target.
Who Made These
William H Huffstetler IV, Viking Restaurant Consultants. Twenty-three years in hospitality management, ServSafe and HACCP certified. The workbooks are built on the same operating standards we use in consulting engagements, and licensed to one business for internal use across every location you own.
Microsoft Excel 2016 or newer, Microsoft 365, or LibreOffice Calc 7 and above. Windows or Mac. Not a substitute for professional accounting or tax advice.
When Typing It In Yourself Stops Being Worth It
A workbook is the right tool when you have one location and an hour a week. Odin's Almanac is what you move to when you would rather the invoices, the POS data and the labor hours arrived on the P&L without anybody keying them.
See the platform